
Every week brings a stream of economic data releases. Employment figures, inflation readings, Federal Reserve decisions and a host of less headline-grabbing reports all help shape investors’ expectations — influencing both borrowing costs and mortgage market activity.
That steady flow of information is easier to follow when it’s tied back to the housing market — which is the focus of HaMMR Digest℠. It connects the week’s economic signals to what they may mean for the mortgage business. Understanding those connections starts with a simple question: what do economic releases actually tell us about mortgage rates and originations?
Mortgage Rates and the 10-Year Treasury
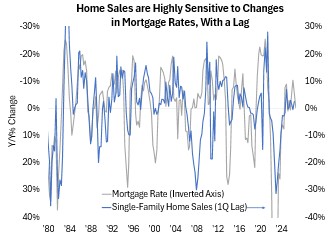
Housing is among the most interest-rate-sensitive sectors in the economy, so if we want to know where home sales and mortgage originations are heading, we first need to know what mortgage rates are doing … and why.
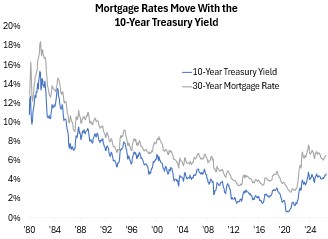
The starting point is the 10-year Treasury yield, which mortgage rates track closely along with a spread that accounts for lender profits, guarantee fees, and the supply and demand for mortgage-backed securities (MBS).
The 10-year Treasury yield is influenced by investors’ expectations for growth, inflation and monetary policy, so each release offers some signal about how the economy is faring today and where it’s headed. When the news points to stronger-than-expected growth or firmer inflation, yields and mortgage rates tend to rise. When the 10-year Treasury yield points the other way, yields and rates tend to fall. This dynamic makes a handful of releases influencing the 10-year Treasury yield worth watching.
Inflation: The Rate Outlook’s Center of Gravity
Inflation sits at the center of the rate outlook. Bond investors care about the real or after-inflation yield they’ll earn. A 4% yield may be appealing when inflation is steady at 2%, but is far less attractive if inflation is running at 3.5%. An upside inflation surprise can therefore push rates higher, while a downside miss can pull them lower. While today’s inflation readings matter, what’s more important is where inflation is headed over the life of the investment.
Measures of underlying inflation — such as core, trimmed mean, median and “sticky” indices — typically carry more signal than the headline number. These measures can also be influenced by business surveys of current and planned price increases, inflation expectations, wage growth and measures of supply-chain stress like delivery times. Any single data point tells you only so much, but together, they start to form a clearer message.
Jobs and Incomes: The Foundation of Housing Demand
Payrolls, jobless claims and income and spending data often move the rate outlook because a stronger economy can mean firmer inflation and higher yields. Here, too, markets react to a surprise relative to expectations as much as to the level itself.
But the labor market and broader economy matter for housing in a more fundamental way as well. Beyond its influence on rates, job and income growth are what ultimately sustain housing demand and support home prices over the long run. Rates shape near-term affordability and the timing of a purchase, whereas incomes determine how much housing families can sustainably afford. A durable pickup in originations usually requires both easing rates and a healthy job market. The ideal balance is a delicate one that goes beyond the headline figures. It can include steady job growth and rising incomes, but not a labor market so tight that it fuels inflation and keeps monetary policy tighter for longer.
Reading the Housing Data: Beyond the Headlines
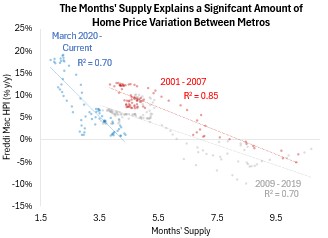
Eventually, all of this feeds back into the housing data itself. Rate moves often show up first in weekly purchase and refinance applications. Factors that often unfold later include rising home sales, new listings and active inventory, months’ supply, prices and construction. Take months’ supply as an example: How long it would take to sell all listings at the current sales pace? Lower months’ supply generally supports faster home price growth, but the mechanism matters: is months’ supply falling because homeowners are pulling listings from the market or because sales are surging from high demand? And of course, all housing is local, so it’s important to go beyond the national headlines and explore regional and city-level trends.
For lenders, following the latest economic and housing data releases can pay off when it comes to planning. An unexpectedly soft Consumer Price Index (CPI) print that lowers mortgage rates can revive refinance pipelines within days, while the transmission to purchase volume and originations plays out over months. No single release will tell you exactly where the market is going, but knowing which releases matter and how to interpret them turns a stream of headlines into a clearer view of the forces shaping your business.
HaMMR Digest Covers Key Indicators, Trends and Metrics.
Provides key housing and economic data each week for a detailed snapshot of industry trends and their possible impact on your business. Includes analysis of key developments by Arch Chief Economist Parker Ross, Assistant Vice President of Global Real Estate Economics Leonidas Mourelatos and Manager of Global Economic Forecasting Nathaniel Drake.
Quarterly Housing Update Webinar: In-Depth Industry Trends and Outlook
Get expert analysis of the current housing market. In our complimentary Housing Update webinars, Arch MI’s housing economics team share their thoughts on the current factors affecting housing and the mortgage industry quarter by quarter throughout the year.